


Introduction: Navigating the Cryptocurrency Market
With an astounding $4.1 billion lost to DeFi hacks in 2024, the urgency for robust trading strategies in cryptocurrency has never been more apparent. As more traders and investors flock to this volatile market, understanding powerful analytical tools is essential for securing profits and minimizing losses.
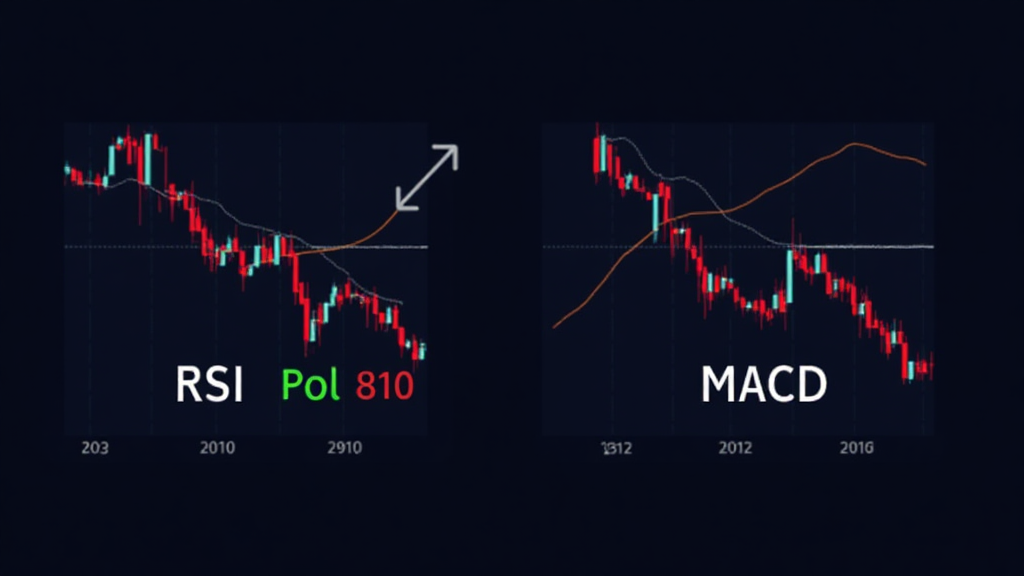
This is where the Relative Strength Index (RSI) and the Moving Average Convergence Divergence (MACD) come into play. In this comprehensive guide, we will delve into how these two indicators can be utilized effectively for crypto trading, while incorporating essential practices suitable for both seasoned investors and newcomers in the Vietnamese market.
The Importance of RSI in Crypto Trading
The Relative Strength Index (RSI) is a momentum oscillator that measures the speed and change of price movements. It helps traders identify overbought or oversold conditions in a market. Generally, an RSI above 70 indicates that a cryptocurrency is overbought, while an RSI below 30 is considered oversold.
- Overbought Condition: Signals potential price reversals.
- Oversold Condition: Suggests possible buying opportunities.
For example, if Bitcoin’s RSI reaches 85, it likely signals that a correction is imminent. This is akin to seeing the fuel gauge in a car nearing the empty mark; it’s a warning that something must be done.
How to Calculate RSI
Calculating the RSI involves the following steps:
- Determine the average gains and losses over a specified period (commonly 14 days).
- Calculate the Relative Strength (RS) as the average gain divided by the average loss.
- Apply the formula: RSI = 100 – (100 / (1 + RS)).
Understanding how to compute the RSI makes you more proficient in utilizing this analytical tool for making informed trading decisions.
The Role of MACD in Crypto Trading
The Moving Average Convergence Divergence (MACD) is another pivotal tool used in cryptocurrency trading. This trend-following momentum indicator illustrates the relationship between two moving averages of a security’s price. The MACD consists of the MACD line, signal line, and histogram.
- MACD Line: The difference between the 12-day and 26-day exponential moving averages (EMAs).
- Signal Line: A 9-day EMA of the MACD line.
- Histogram: The visual representation of the difference between the MACD line and the signal line.
Traders often look for crossovers between the MACD and the signal line to spot potential buy/sell opportunities. For instance, when the MACD line crosses above the signal line, it may indicate a bullish trend, while a crossover below could indicate a bearish trend.
How to Use MACD Effectively
Utilizing the MACD effectively involves watching for:
- Zero Crossovers: A movement above or below the zero line can indicate direction shifts.
- Divergences: When prices move in one direction but the MACD moves in the opposite direction, it can indicate potential reversals.
For instance, if Ethereum’s price continues to rise, but the MACD shows a downward trajectory, this divergence may serve as a warning of a potential price pullback.
Combining RSI and MACD for Enhanced Trading Strategies
Integrating both RSI and MACD can lead to a more comprehensive analysis of market conditions. Using RSI to identify overbought or oversold signals, in combination with MACD crossovers, can significantly enhance decision-making.
Case Study: Real-World Application
Let’s consider a hypothetical scenario in which a trader observes the following:
- Bitcoin’s RSI has reached 75 (overbought).
- The MACD has just crossed below the signal line.
In this case, the trader might decide to take profits or open a short position, anchoring their decision on the confirmation provided by both indicators.
Understanding Market Trends: The Impact on Vietnamese Traders
With the growing adoption of cryptocurrency trading in Vietnam, understanding market trends is crucial. According to reports, the number of cryptocurrency users in Vietnam is projected to increase by 25% in the coming year. As new traders enter the market, utilizing tools like RSI and MACD can aid them in navigating the choppy waters of crypto trading.
Local Resources and Tools
Vietnam is home to numerous trading platforms and communities that can assist local traders. Engaging with these resources can provide additional insights on market conditions:
- Join local trading groups on platforms like Telegram and Facebook.
- Participate in webinars focusing on technical analysis.
Conclusion: Your Next Steps in Crypto Trading
In conclusion, leveraging indicators like RSI and MACD not only enhances your trading strategies but also empowers you to make informed decisions in the ever-volatile cryptocurrency market. Remember, the right tools can safeguard your investments and increase your potential for profit.
As you embark on your trading journey or seek to refine your strategies, consider integrating these techniques into your routine. With the proper knowledge and tools at your disposal, the cryptocurrency market can be navigated with greater confidence.
For more resources on cryptocurrency strategies, visit cryptoswapdex.

